記事の最後に行く
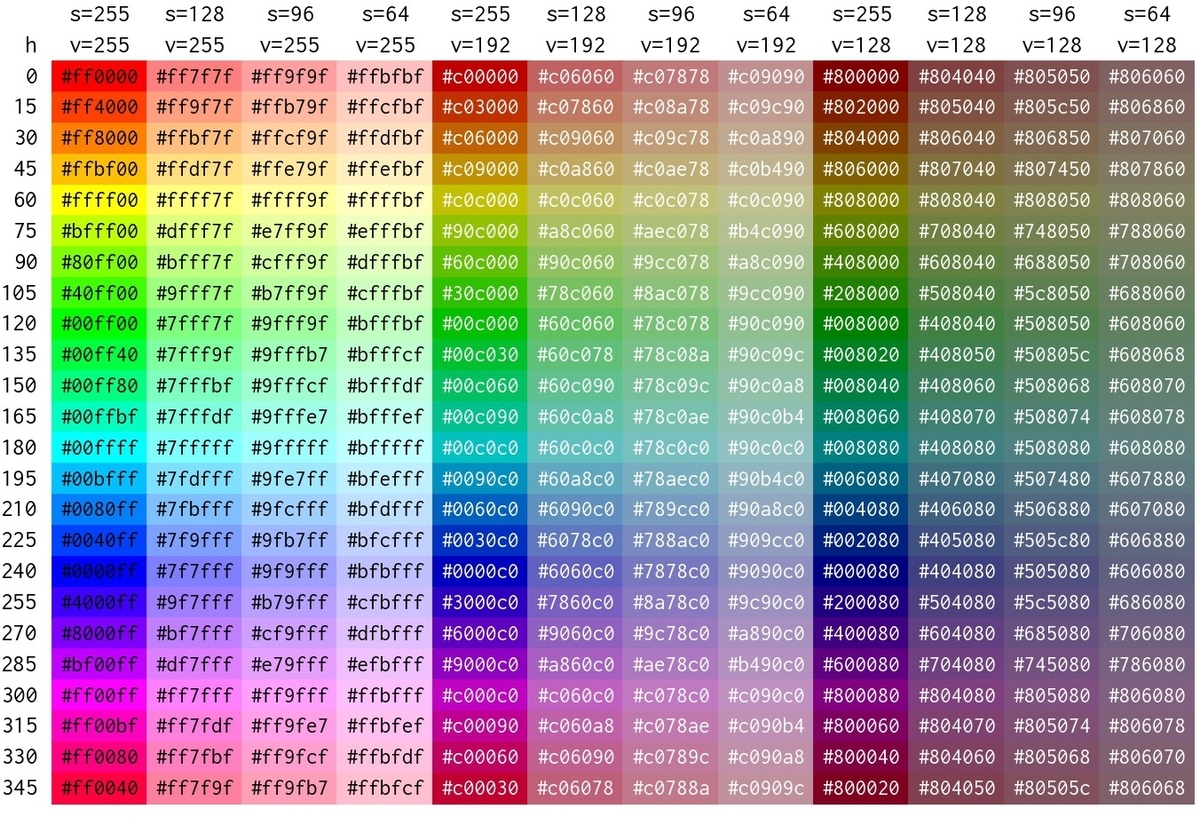
色見本作成プログラム
import matplotlib.pyplot as plt
import colorsys
import subprocess
def drawfig(ls_h,ls_s,ls_v):
scolor=defcolor(ls_h,ls_s,ls_v)
n=len(ls_h)
m=len(ls_s)
fsz=9
xmin=-1.0
xmax=float(m)
ymin=-2.0
ymax=float(n)
plt.figure(figsize=(9,6),facecolor='w')
plt.rcParams['font.family'] = 'Ricty Diminished'
plt.xlim([xmin,xmax])
plt.ylim([ymax,ymin])
plt.axis('off')
fsz=9
k=-1
for i in range(0,n):
for j in range(0,m):
k=k+1
col=scolor[k]
xs=float(j)
xe=xs+1.0
ys=float(i)
ye=ys+1.0
rectangle = plt.Rectangle((xs, ys), xe-xs, ye-ys, fc=col,ec=col)
plt.gca().add_patch(rectangle)
xg=0.5*(xs+xe)
yg=0.5*(ys+ye)
cn='#000000'
if 4<=j: cn='#ffffff'
plt.text(xg,yg,col,rotation=0,ha='center',va='center',fontsize=fsz,color=cn)
fsz=10
x=-0.15
for i,h in enumerate(ls_h):
y=float(i)+0.5
cn='#000000'
plt.text(x,y,str(h),ha='right',va='center',fontsize=fsz,color=cn)
plt.text(x,-0.5,'h',ha='right',va='center',fontsize=fsz,color=cn)
yv=-0.5
ys=-1.5
x=-0.5
for s,v in zip(ls_s,ls_v):
x=x+1.0
cn='#000000'
plt.text(x,ys,'s='+str(s),ha='center',va='center',fontsize=fsz,color=cn)
plt.text(x,yv,'v='+str(v),ha='center',va='center',fontsize=fsz,color=cn)
fnameF='fig_col_hsv.jpg'
plt.savefig(fnameF, dpi=200, bbox_inches="tight", pad_inches=0.2)
plt.show()
def defcolor(ls_h,ls_s,ls_v):
scolor=[]
for ii,h in enumerate(ls_h):
for s,v in zip(ls_s,ls_v):
r,g,b=colorsys.hsv_to_rgb(h/360, s/255, v/255)
ir=int(round(r*255,0))
ig=int(round(g*255,0))
ib=int(round(b*255,0))
hrgb='#{0:02x}{1:02x}{2:02x}'.format(ir,ig,ib)
scolor=scolor+[hrgb]
return scolor
def main():
ls_h=[0,15,30,45,60,75,90,105,120,135,150,165,180,195,210,225,240,255,270,285,300,315,330,345]
ls_s=[255,128, 96, 64,255,128, 96, 64,255,128, 96, 64]
ls_v=[255,255,255,255,192,192,192,192,128,128,128,128]
drawfig(ls_h,ls_s,ls_v)
cmd='convert fig_col_hsv.jpg -trim fig_col_hsv.jpg'
subprocess.call(cmd,shell=True)
if __name__ == '__main__': main()
色見本画像

Thank you.
記事の先頭に行く
